
Calculate the ROI of using Beautiful.ai
Estimate how much time and money your team can save on presentations each year.

Trusted by professionals at over 100,000 companies
What teams report saving with Beautiful.ai
Based on survey responses from Beautiful.ai users across roles and seniority.
Median time saved per creator/week
3 Hours
Median time saved per deck/week
2 Hours
Average savings (per user/year)
Beautiful.ai can help your company save hundreds of thousands of dollars each year by improving productivity and efficiency.
$20,000
Role
Avg hrs/wk saved
Avg Salary
Value Saved/Year
Sales Ops/RevOps
8.8
$123,000
$26,000
Marketing Manager
7.8
$122,000
$23,000
Design/Creative
6.6
$61,000
$10,000
Finance/Accounting
6.5
$106,000
$17,000
HR/People Ops
6.4
$120,000
$19,200

“We have more people telling better stories, 10 times faster, because of Beautiful.ai.”
Alex Richter
Parnter and CMO, Camelot Strategic Marketing and Media
“The time savings with Beautiful.ai has been huge. I would say anywhere from 50-75% reduction in time. We could have the sales team or other people help with slides, we don’t need a designer on hand every minute.”
Brenda Ramsey
Creative Director, Paciolan
“In Beautiful.ai we can create a very high caliber presentation, without dedicating a significant amount of time.”
Roger Lewis
CEO, CMIT Solutions
Create stunning, on-brand presentations that save you hours of time
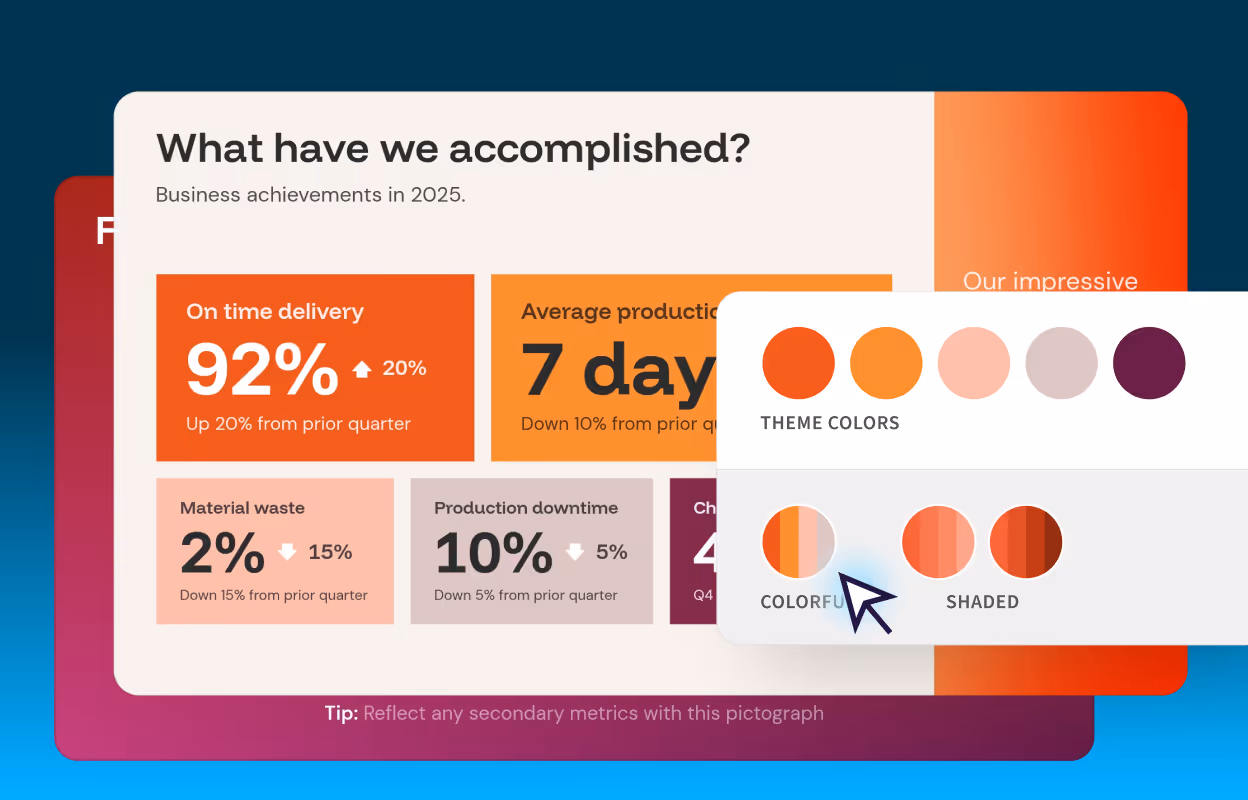
Keep every deck on brand —at global scale
Beautiful.ai gives enterprise teams the guardrails to protect brand integrity across regions and business units with templates, themes, and shared assets.
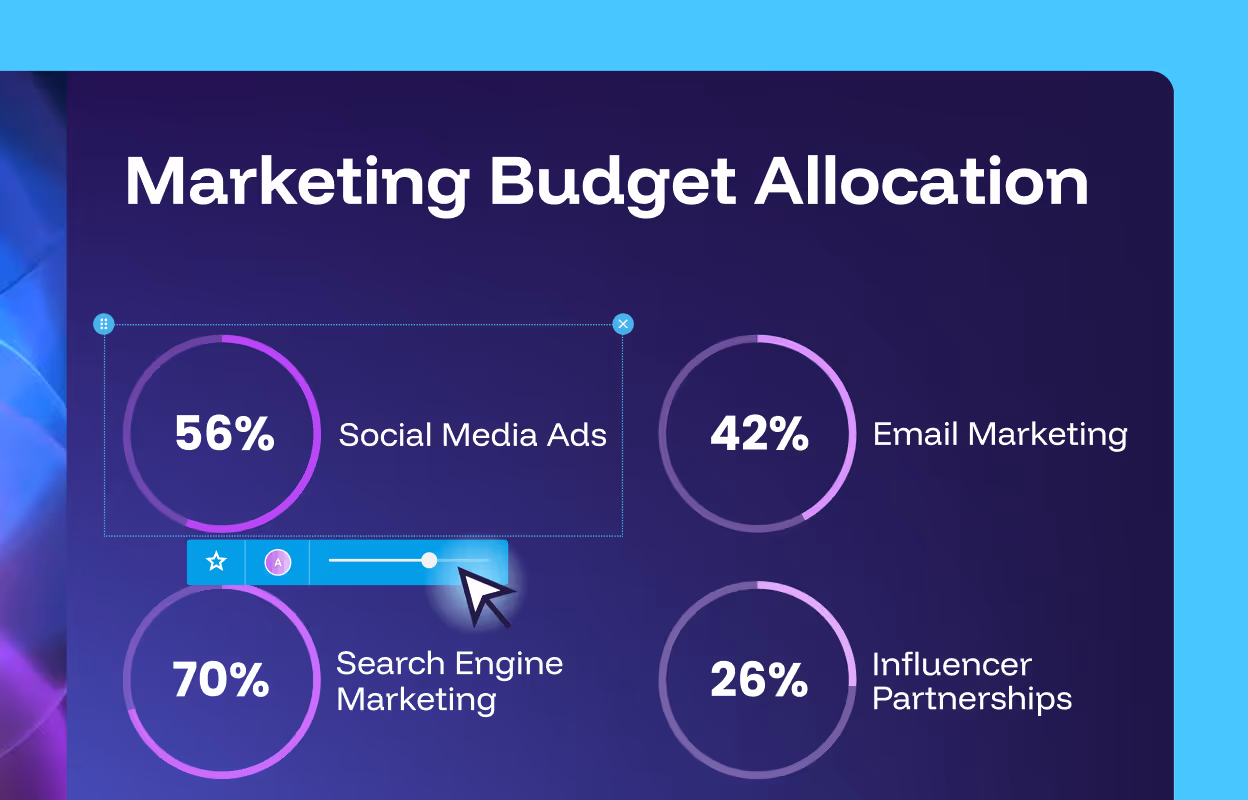
Give time back to your team’s expertise
Every hour spent fixing slides is an hour lost on impactful work. Beautiful.ai helps teams win that time back. Smart Slides automate slide busywork.
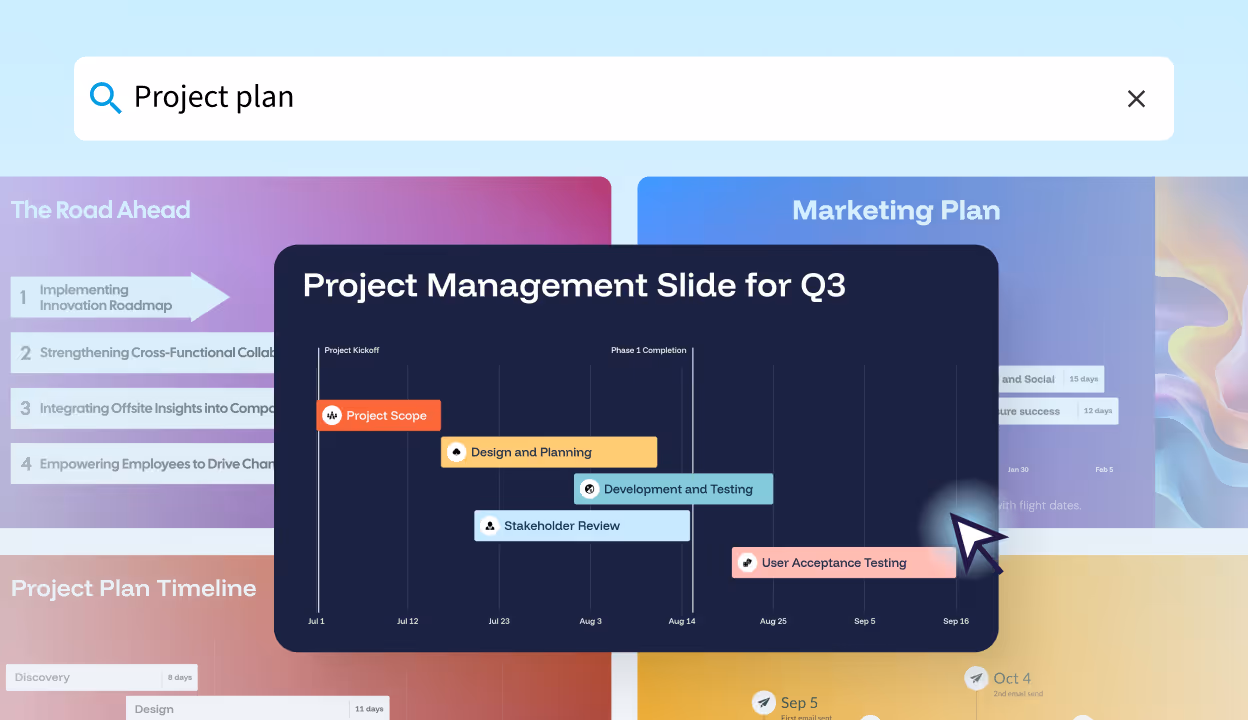
Shared team templates
Give your organization a single source of truth for presentations. With shared templates, every team can build faster.

3rd party integrations
Improve your workflow with Beautiful.ai’s 3rd party integrations. Move faster with Slack, ChatGPT, Salesforce, and more.
Frequently asked questions
We use a benchmark from our user survey: teams report a median of 2 hours saved per presentation using Beautiful.ai.
We apply that time savings to your team’s presentation volume to estimate total hours and cost savings.
Annual dollars saved = annual hours saved × hourly rate
You can enter your team’s average hourly rate, or use the default benchmark.
This is based on our survey benchmark: 2 hours saved per presentation (median).
Annual hours saved = presentations per month × 12 × 2 hours saved per deck.
This reflects your team’s total presentation output over a year.
The default rate is an estimate of hourly cost based on U.S. median fully loaded compensation benchmarks (i.e., not just salary—fully loaded cost) across common roles and seniority bands.

Discover a faster way to create stunning presentations.
Work smart, work simple, work beautiful.

