
AI for data visualizations that drives decisions
Turn any spreadsheet into an animated slide that makes insights clear. Beautiful.ai gives you a complete library of data slides; charts, graphs, timelines, diagrams, and more.
From raw data to
ready-to-present stories
Beautiful.ai transforms CSVs, Excel, and Sheets into on-brand charts, dashboards, and timelines.

Tell the story behind the stats
Numbers alone don’t inspire action. Smart Slides help you turn raw metrics into clear, visual narratives that explain progress, highlight opportunities, and make complex data easy to understand.
Smart Slides: Your built-in designer
No more formatting headaches or messy charts. Smart Slides automatically transform your data into visuals that make an impact. Discover content that automatically aligns and animates.
Always accurate, up-to-date slides
Upload a spreadsheet or paste your data and Smart Slides turn it into stunning graphs, charts, comparisons, and more.
Build decks that speak data fluently
Beautiful.ai helps you transform KPIs, trends, and results into clear, visual presentations that make insights easy to see, and even easier to share.
Perfect for:

How to bring data to life, beautifully
From spreadsheets to standout slides in minutes.
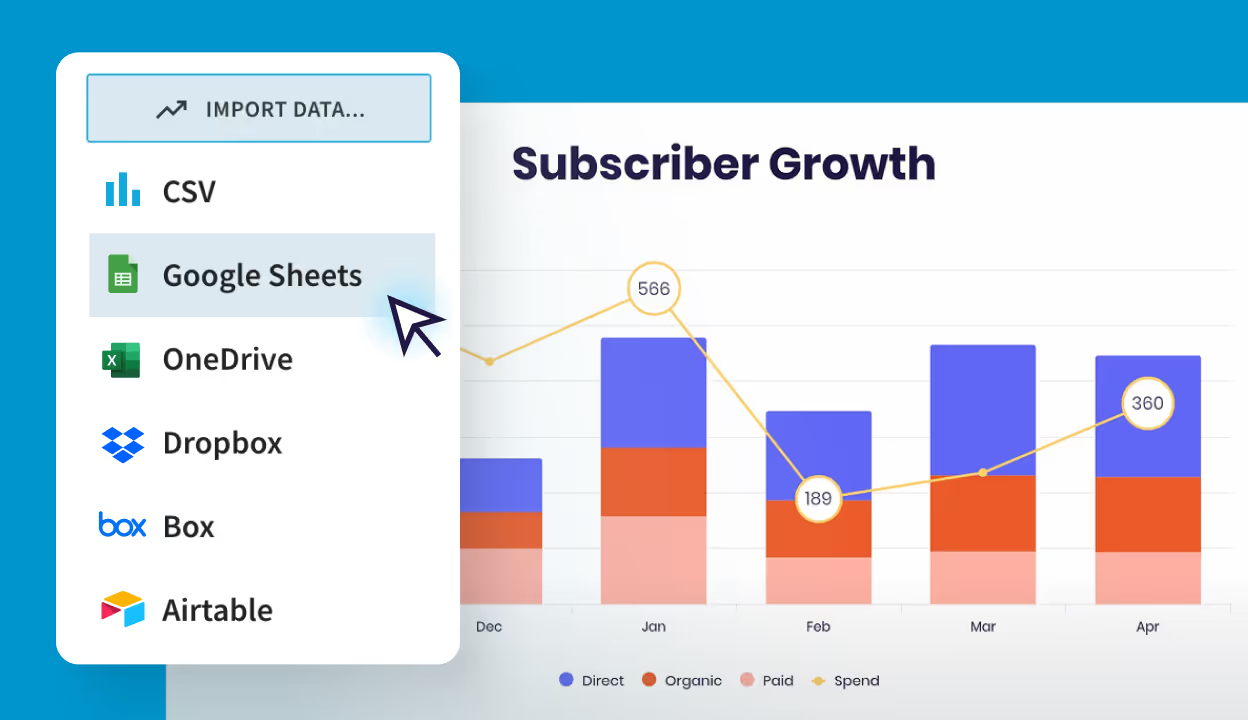
Connect data from CSV, Excel, or Sheets
Enable real-time updates by linking data sources. Great for dynamic presentations or frequently changing metrics.
Pick the perfect Smart Slide for your data
Choose from a variety of chart and data slides including: Line, bar, pie, waterfall, area, donut and many more.
See every layout auto-adjust
Each slide is smart, and designs with you. Layouts and numbers resize as you edit, color logic is automatically applied to your charts, and animations bring your content to life.
Edit numbers directly, too
Quickly enter, update, or adjust specific data points, making edits a breeze.
Get a headstart with our presentation templates
Each template is built with Smart Slides, so you can apply your theme styling, and deliver polished work fast.

KPI Marketing Report Template

Quarterly Marketing Report Presentation Template

Monthly Strategy Review Presentation Template

Year in Review Presentation Template

Survey Results Presentation Template

Investor Presentation Template
Choose the perfect Smart Slide for your data
Smart Slides are pre-built layouts that automatically align and resize as you add and edit your content. Smart Slides turn complex data into clear, polished visuals that make insights easy to understand.

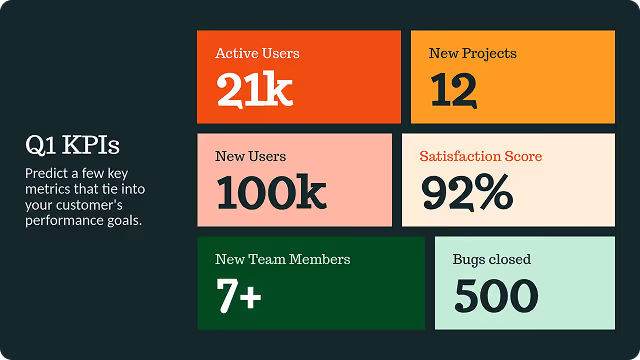
Big Number Smart Slide
Spotlight a single KPI or headline metric
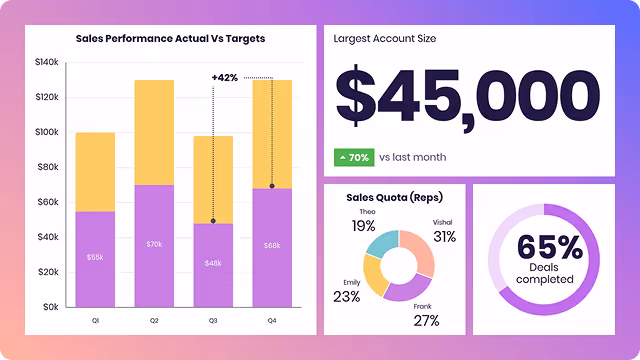
Dashboard Slide
Compact set of mini-charts for overviews.
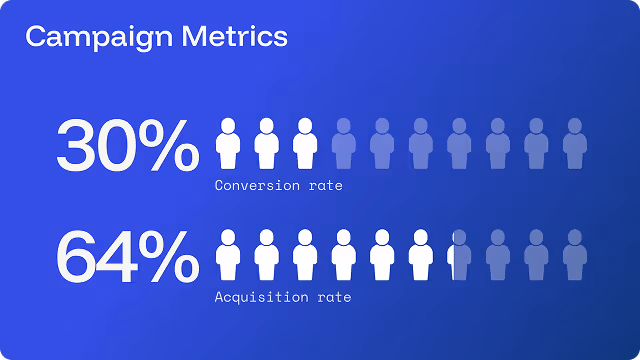
Percentage With Icons Slide
Visualize percentages using icons.
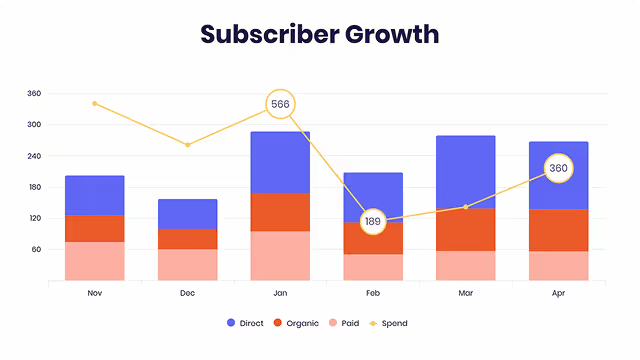
Column Chart Slide
Compare categories with vertical bars.
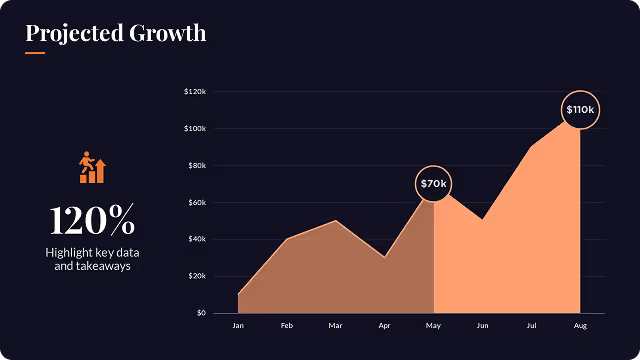
Area Chart Slide
Emphasize cumulative volume or trends.
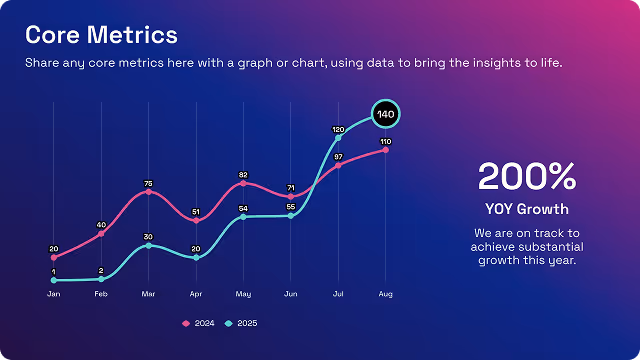
Line Chart Slide
Show data trends over time.
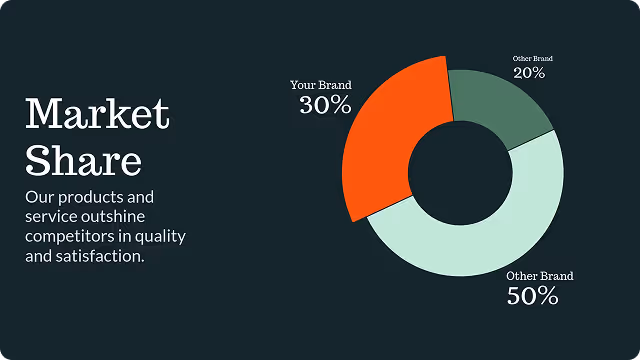
Pie Chart Slide
Simple breakdowns at a glance.
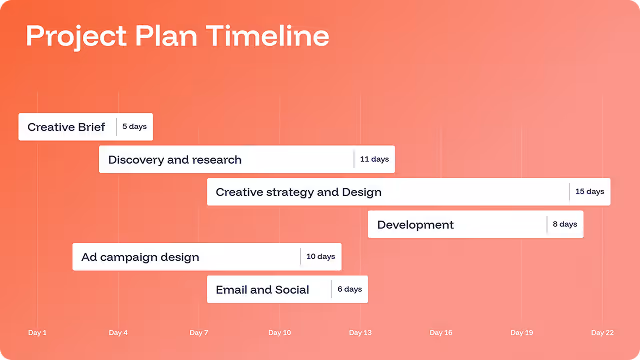
Gantt Chart Slide
Project plan or timeline.
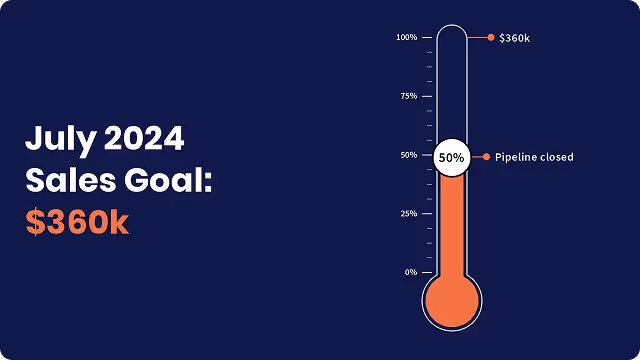
Thermometer
Show progress toward a goal with a vertical animation.
Discover a faster way to create stunning presentations.
Work smart, work simple, work beautiful.
